
Getting Started with Indoor Cycling
First Signs of Progress

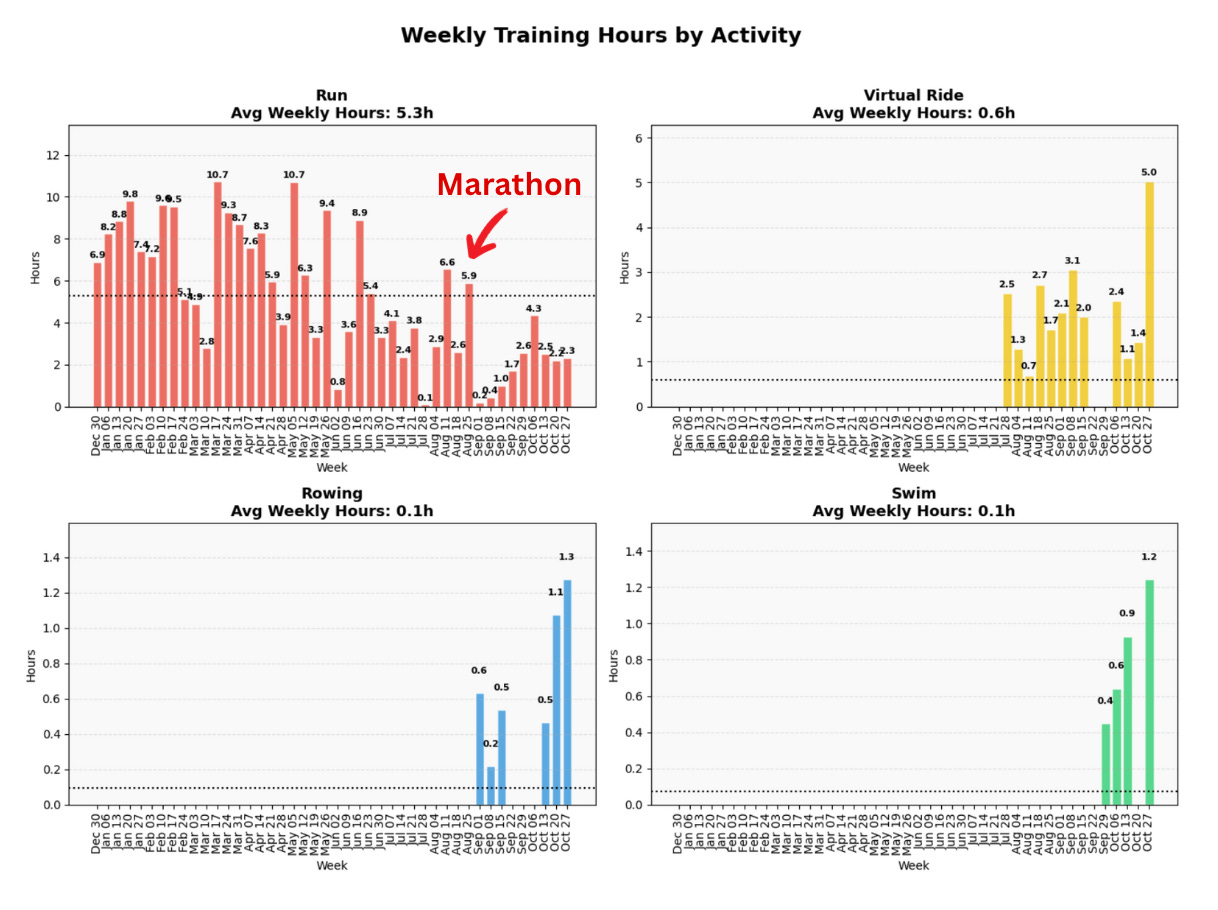
For the past two years, my endurance training has consisted almost entirely of running.
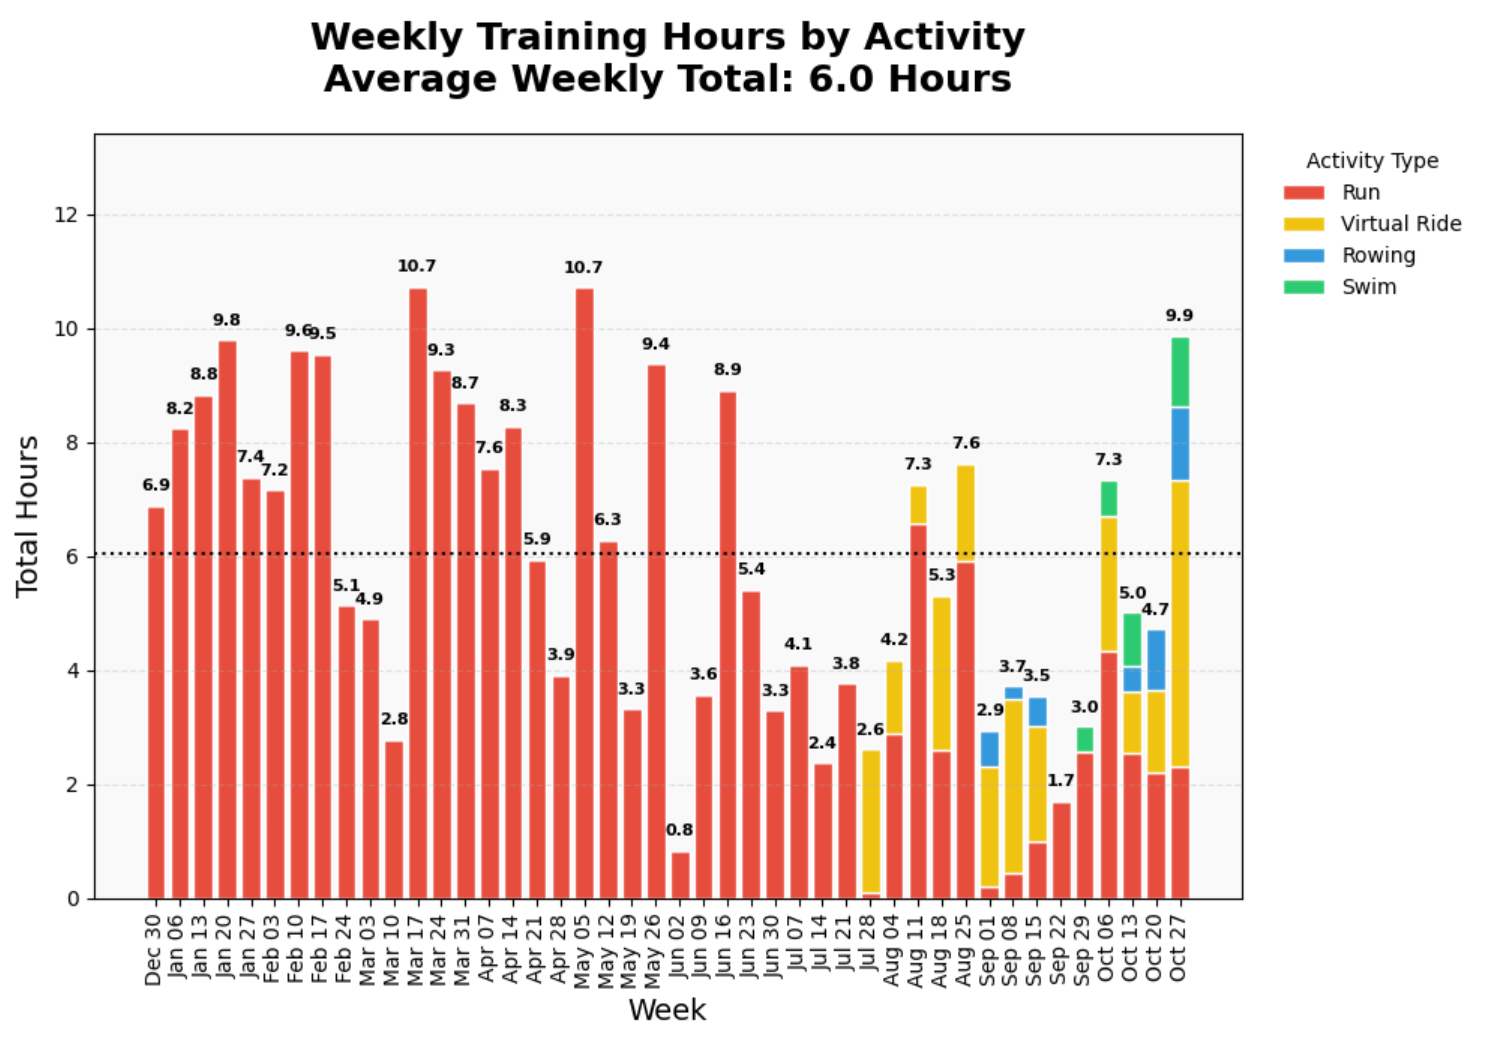
But recently I’ve started experimenting with other training modalities—mainly indoor cycling, rowing, and swimming.
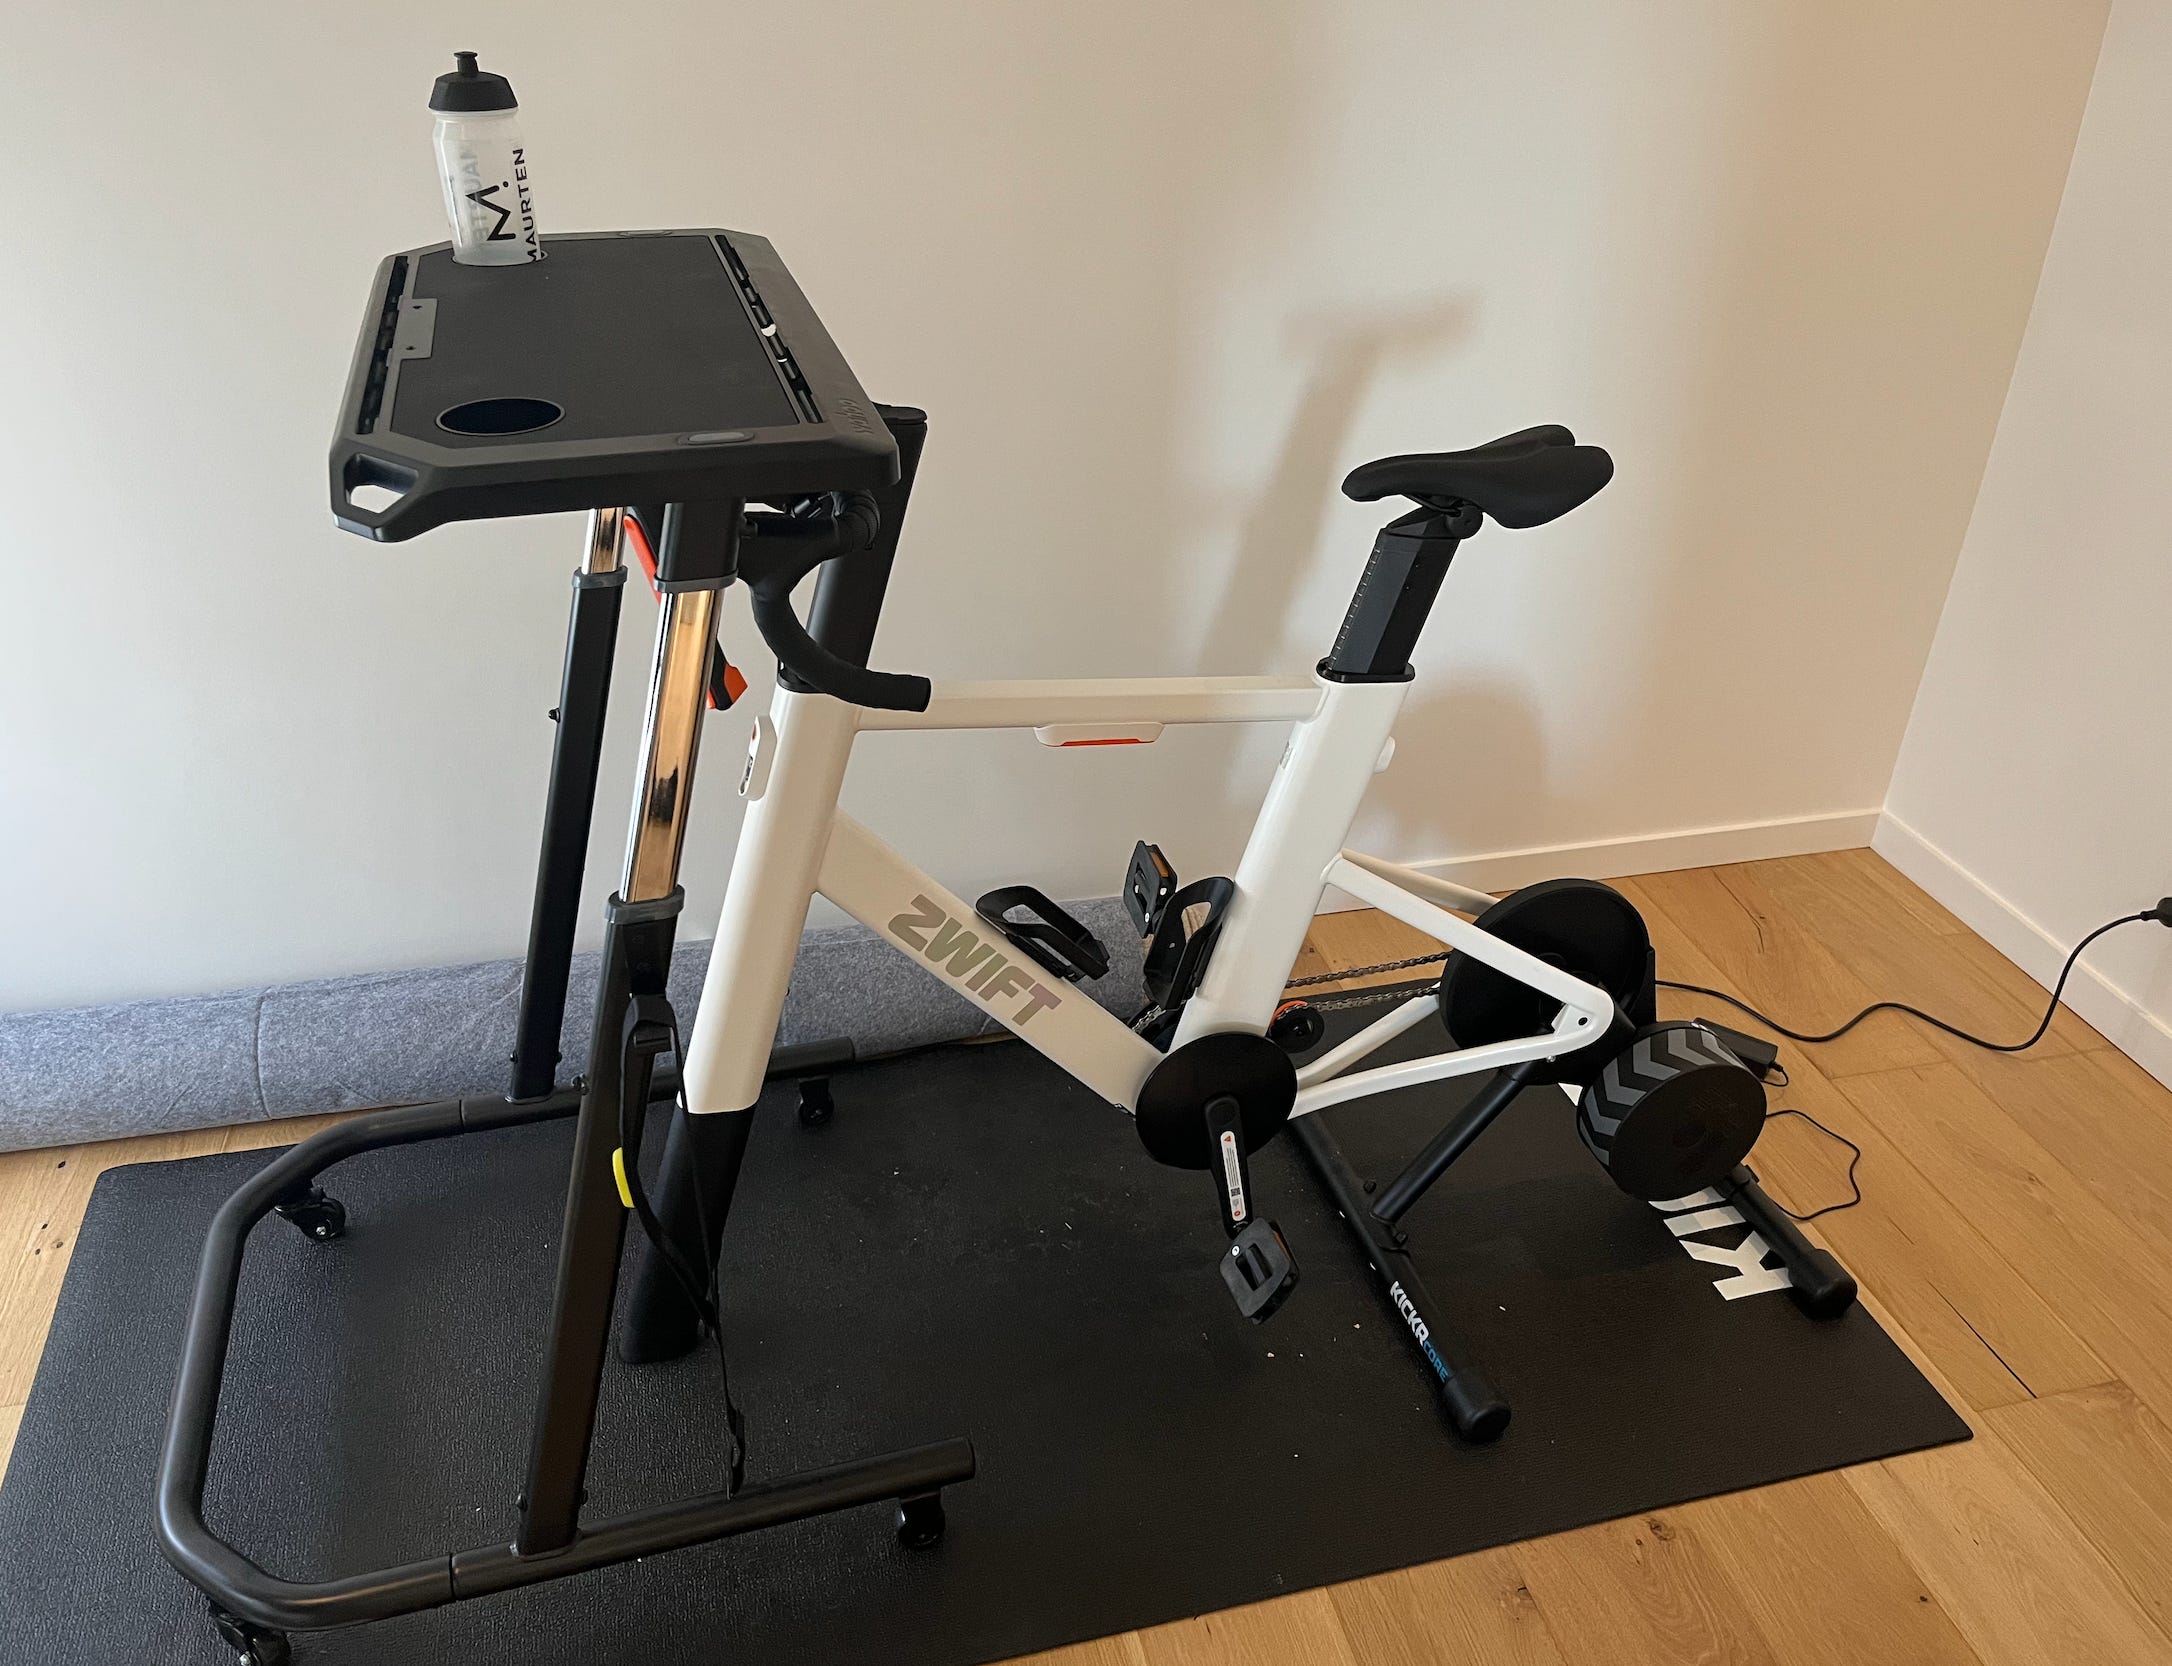
For cycling, I’m using a Zwift indoor trainer.
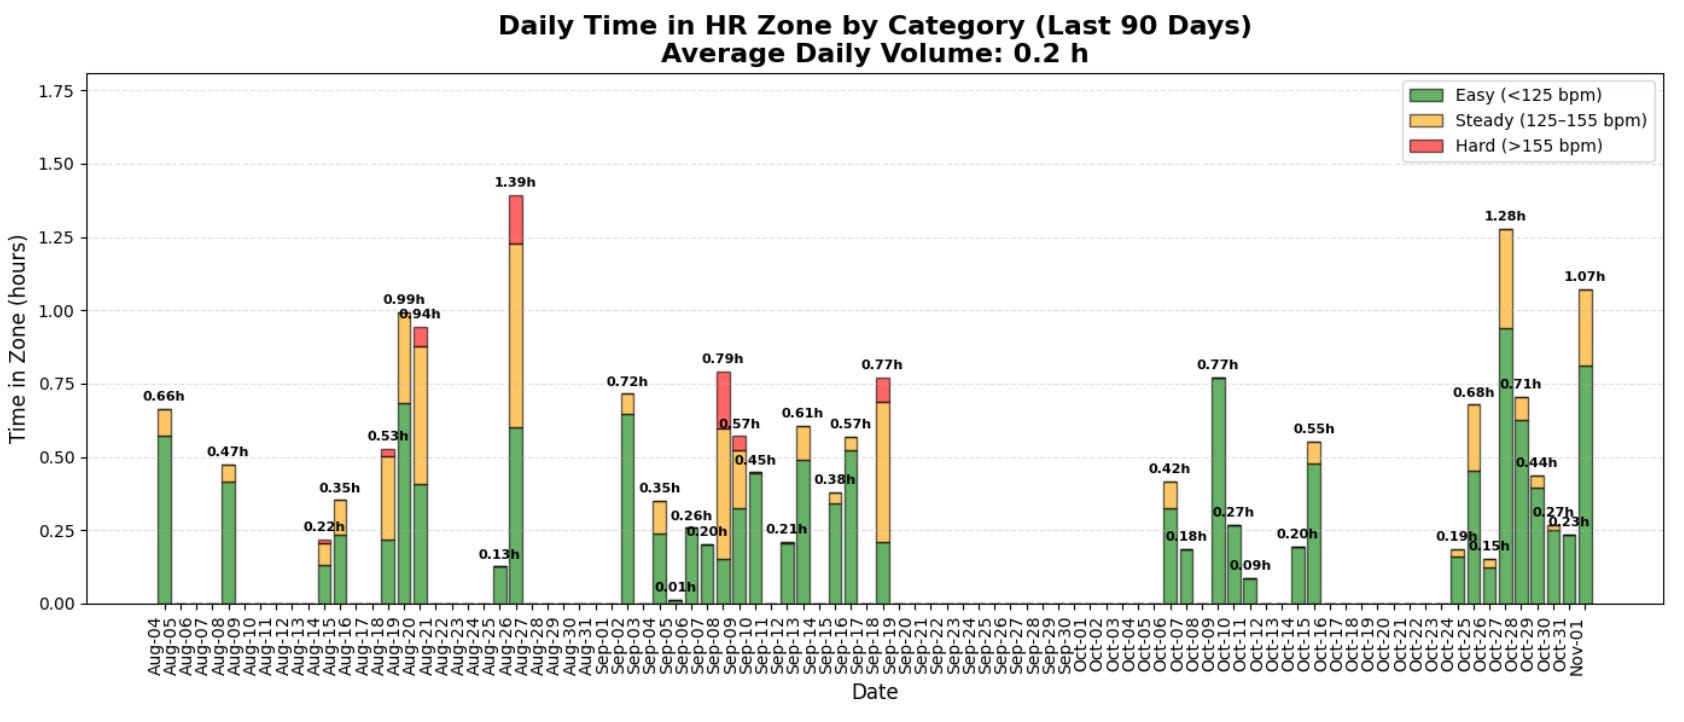
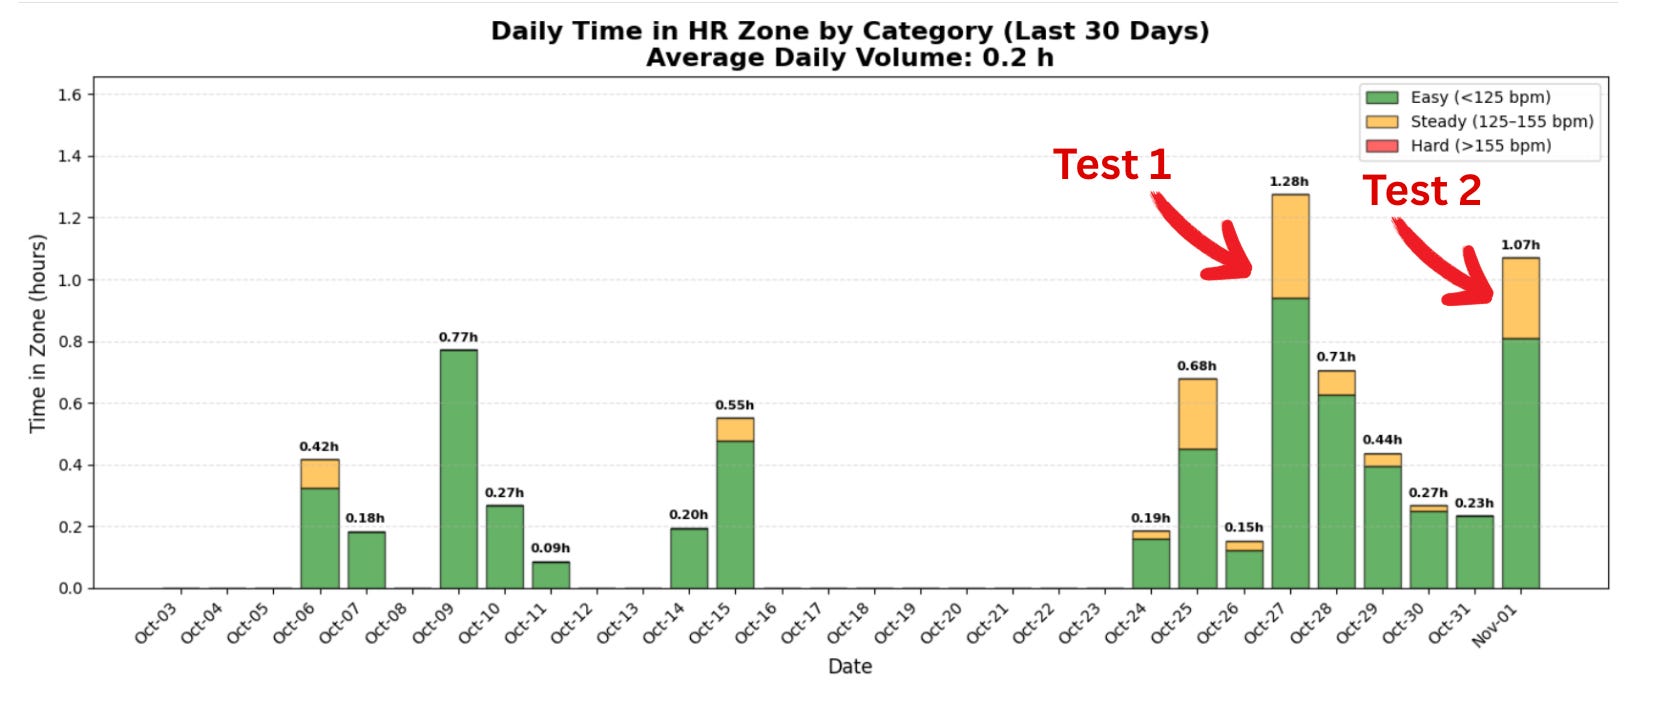
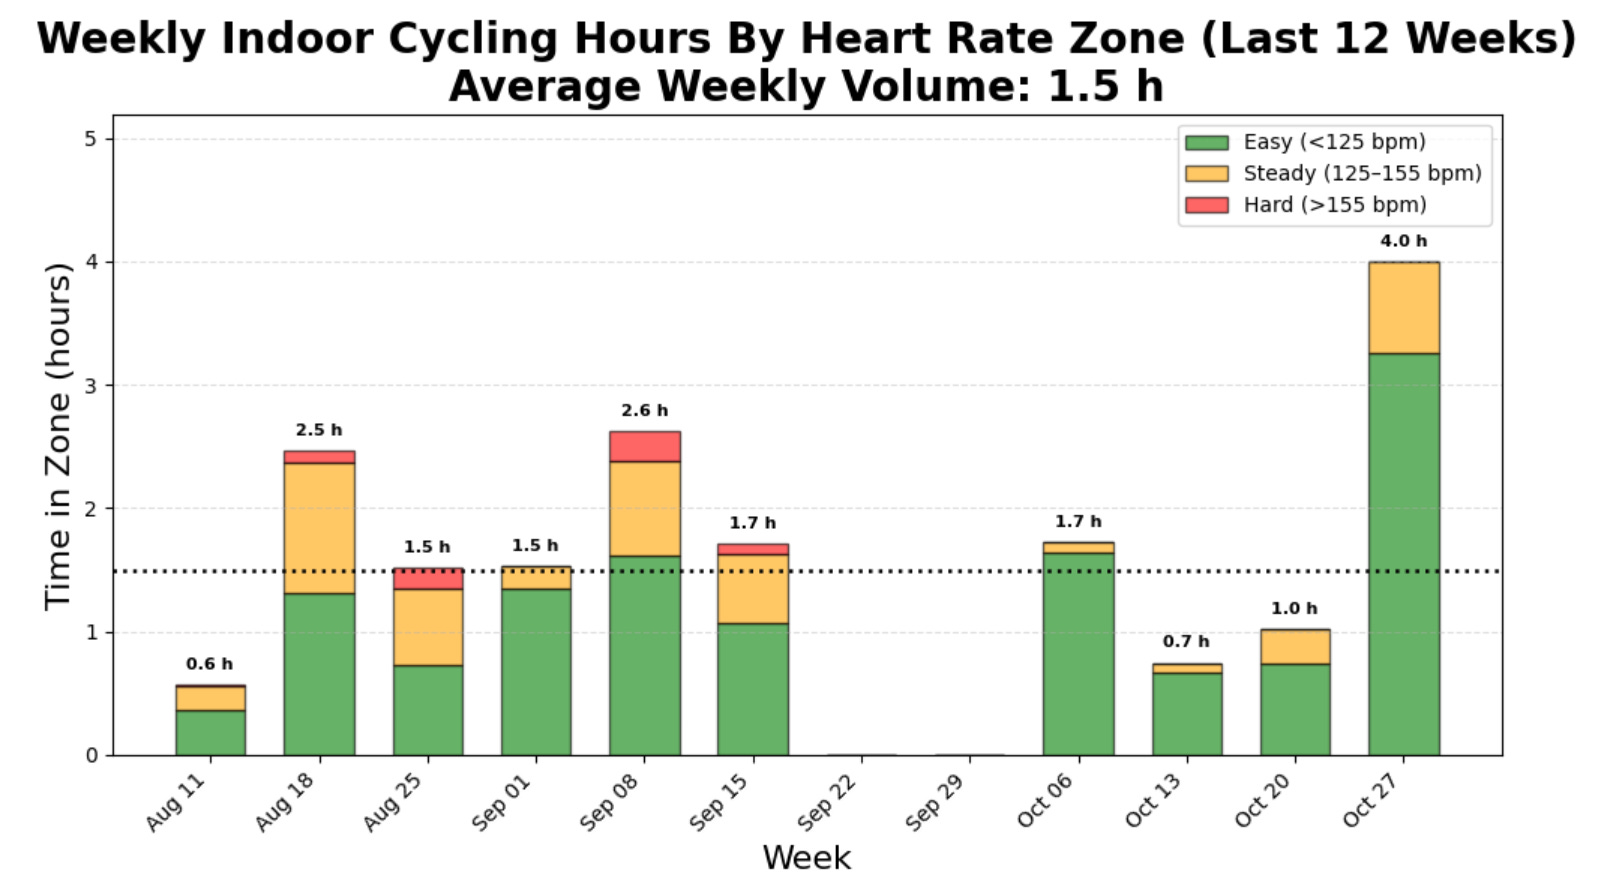
Over the last 90 days, I’ve averaged about 12 minutes a day on the trainer (around 1.5 hours per week). This is gradually increasing as I get more comfortable spending longer periods on the bike.
A few things have helped with comfort so far:
I’ve set the bike up in a very upright position, which feels more tolerable.
Watching YouTube videos helps distract from the mild discomfort.
I always keep a water bottle filled and within reach.
Testing and Performance
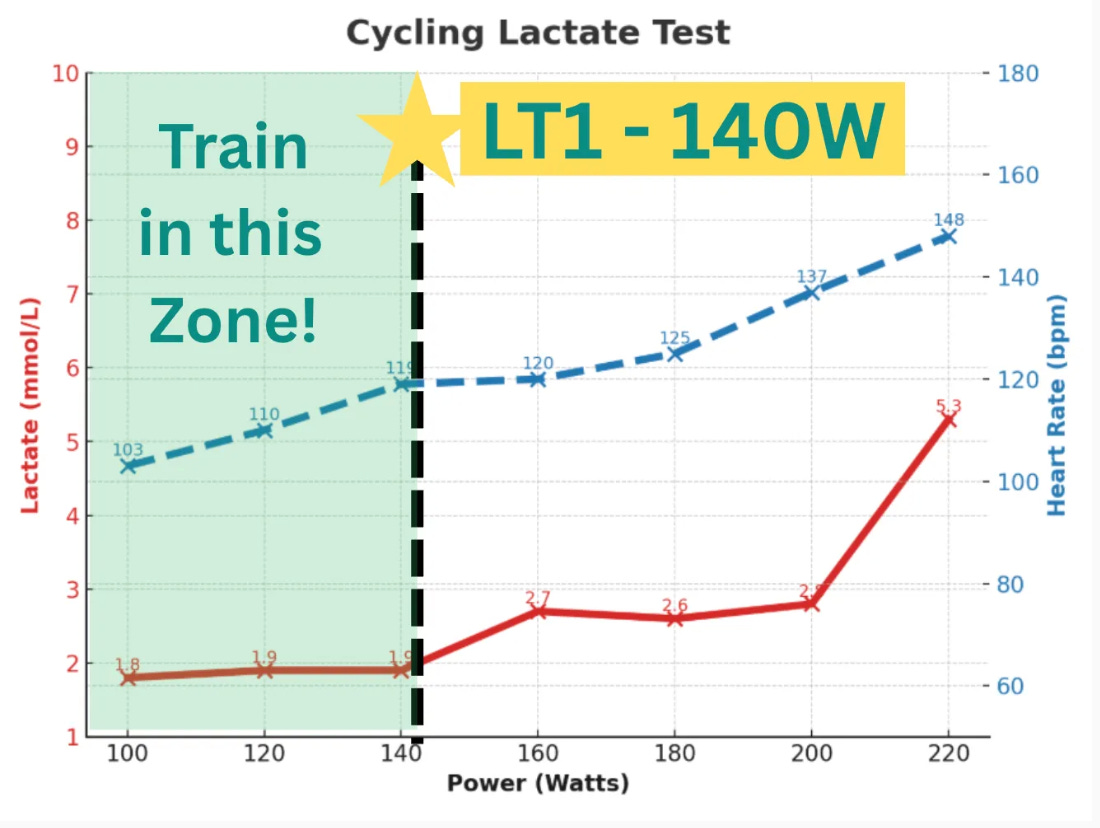
In recent weeks, I’ve begun testing my performance on the bike. In my first test, I established that around 140W sits at the top of my “green zone.”
You can read about that testing here.
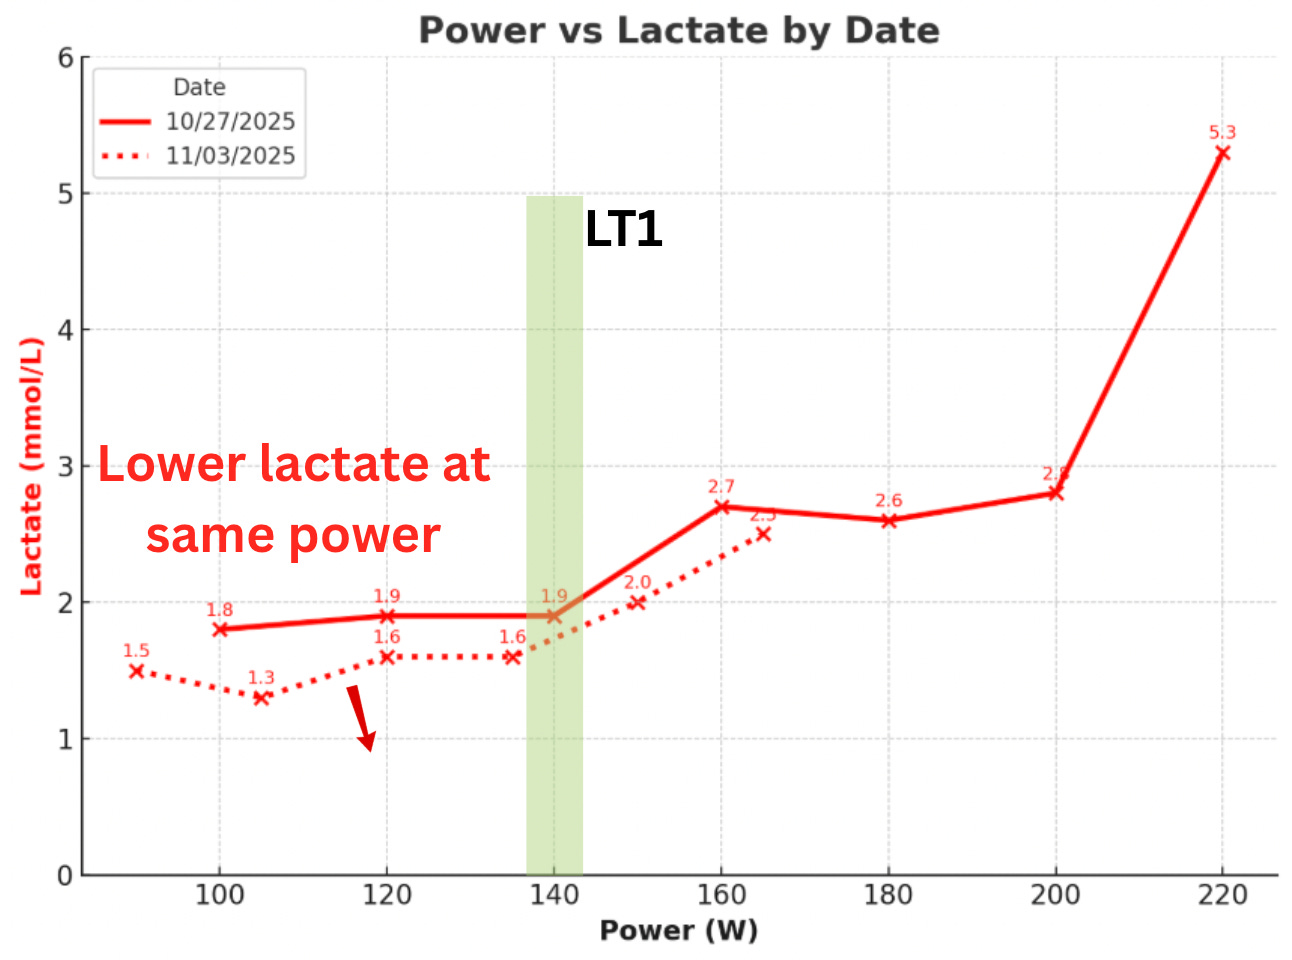
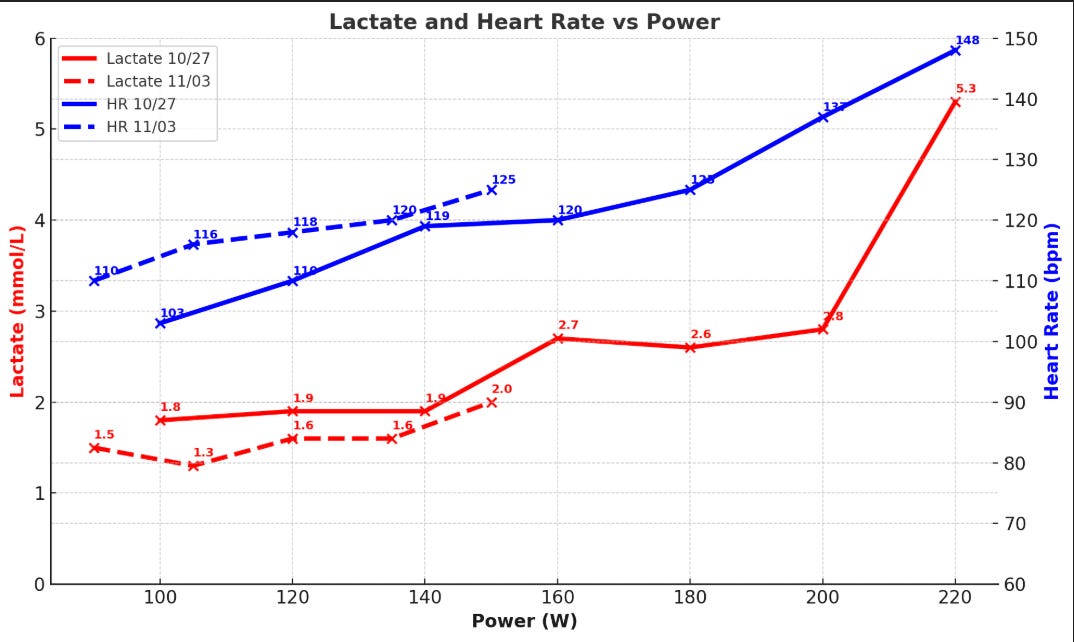
A week later, I retested and saw signs of improvement—my lactate profile shifted down (a positive result), meaning I can now generate more power at the same lactate cost. That’s a great indicator that the training is working. 😁
Using those lactate results, I’ve set some rough heart rate zones for training:
<125 bpm: easy (roughly LT1)
125–155 bpm: steady (roughly LT1–LT2)
>155 bpm: hard (roughly LT2 and above)
Current Training Approach
Right now, my training is very simple. I just get on the bike and pedal easily, focusing on time rather than specific metrics. I rarely watch the power numbers in real time—every few minutes I’ll glance at the screen to check my heart rate. My main goal is to keep it below 125 bpm (easy) for almost all of the session.
Looking at my rides from the past 90 days, I’ve done well to keep most sessions in the “green” zone. The power chart shows a bit more “red,” but I’m not too concerned—heart rate and perceived effort are my main guides for now.
Progress and Motivation
My key metric at the moment is weekly hours on the bike. Last week, I reached 4 hours.
Interestingly, the “lactate testing” session ended up being my longest ride yet—70 minutes. Nothing motivates me more than the curiosity of collecting data!
Goal will be to slowly increase the time on bike in the coming weeks. I’ll keep on testing regularly so we can see the progress!
Read More
Here’s the lactate test I used to establish my cycling green zone.
My running this year culminated in a sub-3 hour marathon in Sydney. You can read about this here.
Bek Olimjon is on a very similar journey at the moment. He’s working with Gordo Byrn as his coach. You can read about Bek’s initial lactate testing here.
Great read John. Enjoyed it. One thing I noticed when it comes to lactate testing - it varies a lot. One day my baseline is 0,7 and another day 1.7. I assume it reflects in next steps of testing too. Therefore, I keep a record of time of the test and when and what I ate before the test. Carbs increase the lactate significantly. Another thing is that depending on the time of the day and how my overall energy levels power output varies ±10-15W for the same HR. So, I agree with you not focusing too much on watts. Focusing on HR is way easier. I enjoy your material, John. Keep them coming :)
Solid John! Liked it a lot 🤝