


VO2 Max, Zone 2 Power, and Muscle Mass – My 2024 Update
The Integral Metrics of Long Term Fitness

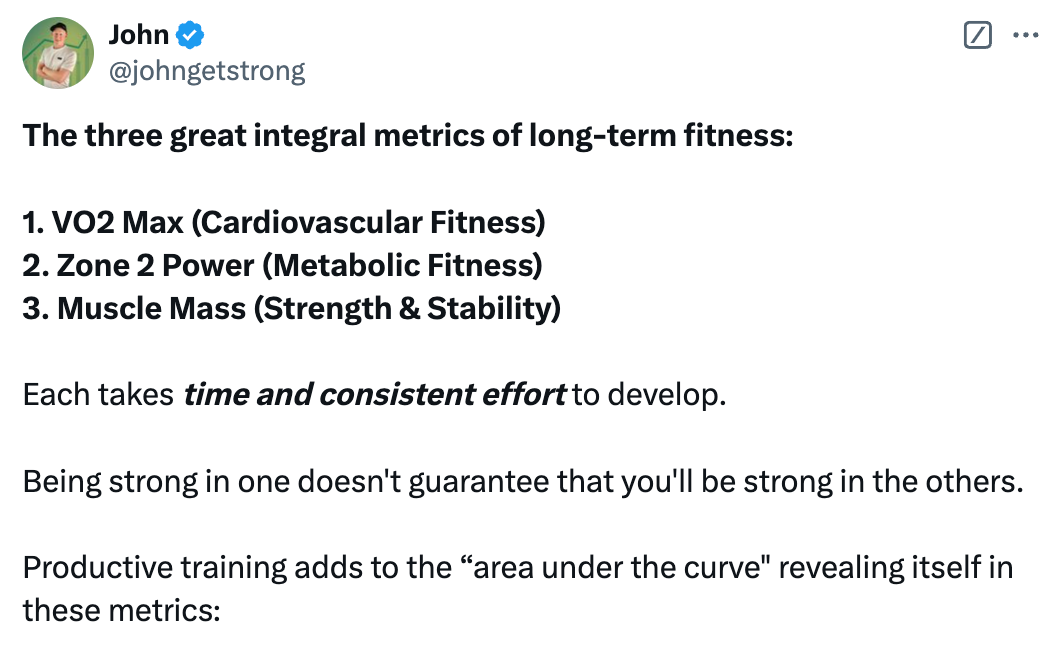
There are three major metrics I’ve been using to track long-term fitness: VO2 Max, Zone 2 Power, and Muscle Mass.
VO2 Max provides an indication of top-end cardiovascular fitness. It’s the fitness metric best correlated with long-term health.
Zone 2 Power provides an indication of metabolic fitness, measuring the strength of your mitochondria and your ability to use multiple fuel sources to power activity. Metabolic fitness exists on a continuum, from extreme flexibility (think Tour de France cyclists) to metabolic dysregulation (e.g., diabetes).
Muscle mass is a good overall indicator of strength. Although not a direct measure of strength, the two tend to correlate, with strength increasing as muscle mass increases.
I like these three metrics for tracking long-term fitness because they represent the accumulation of long-term effort. Each requires a considerable amount of dedication and consistent work to develop.
Goals
At the start of this year, I set the following rough goals for these metrics:
VO2 Max: 55 mL/kg/min
Fat-Free Mass Index (FFMI): 22 kg/m²
Zone 2 Power: Running pace of 4:30 min/km in Zone 2
The first two are based on data representing the top 10th percentile for my age. The last metric reflects what I subjectively consider a very good Zone 2 running pace.

This year, I got very close to reaching each of these goals. In this post I’ll break down the progress and highlight the training that enabled these results.

Progress on Each Metric
VO2 Max
In January, my VO2 Max measured 54.3. By mid-December, it had improved to 56.2.
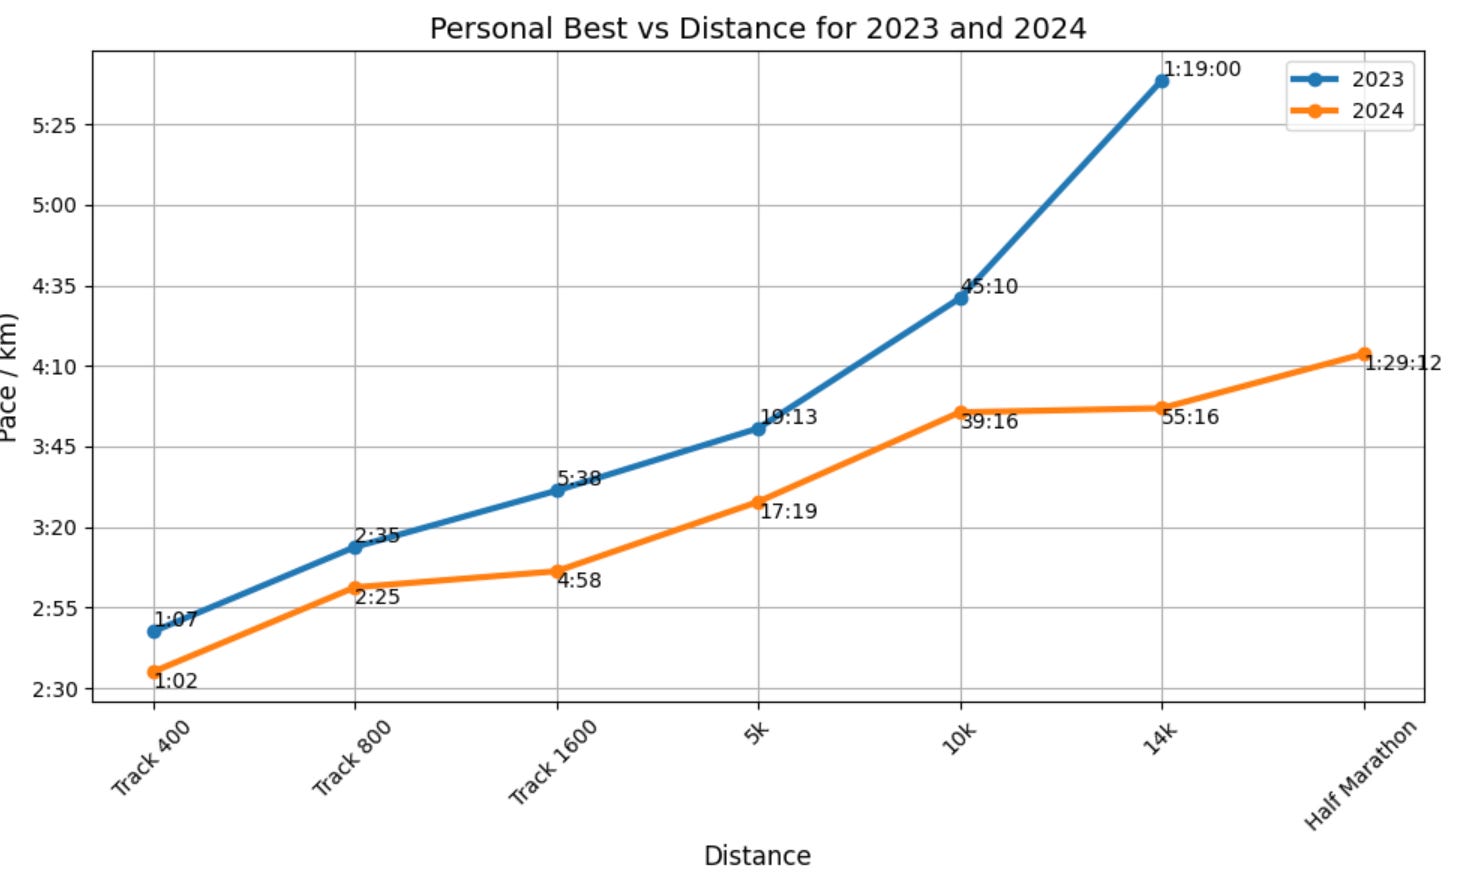
5 km running times, which correlate closely with VO2 Max, also dropped dramatically this year, from a personal best of 19:12 in 2023 to 17:20 in 2024.

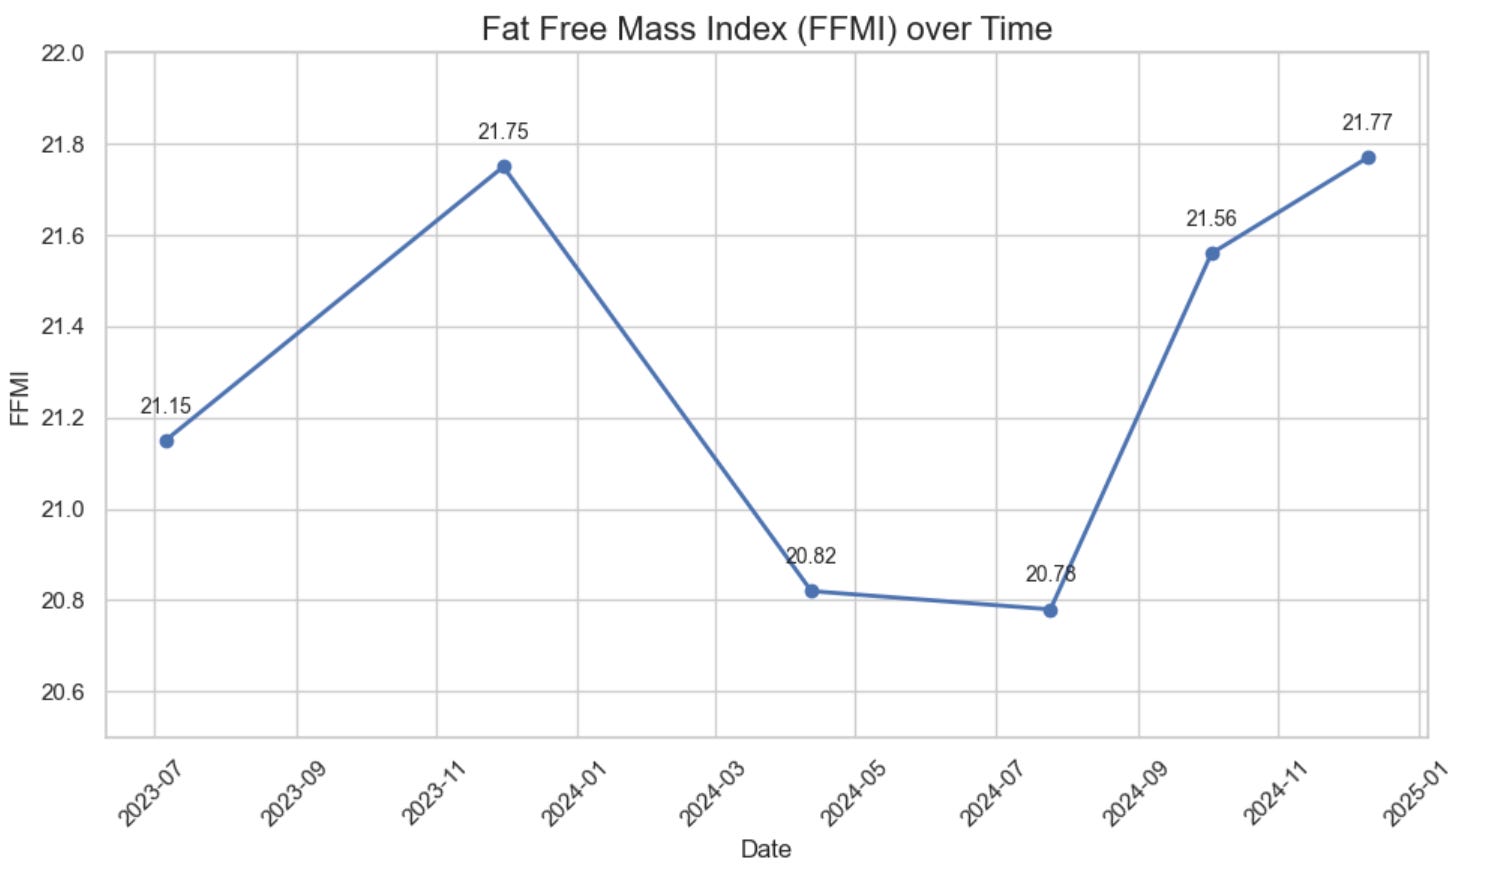
Muscle Mass
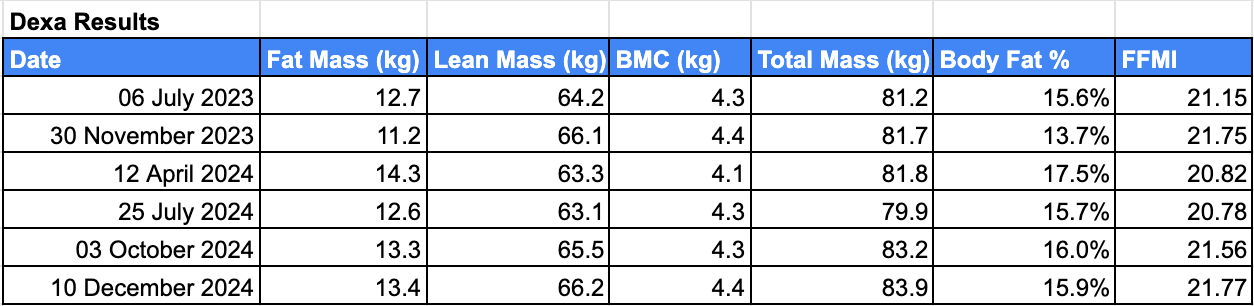
My body composition remained relatively stable. I track muscle mass using a metric called Fat-Free Mass Index (FFMI). This increased to 21.77, just a little below my end goal of 22.
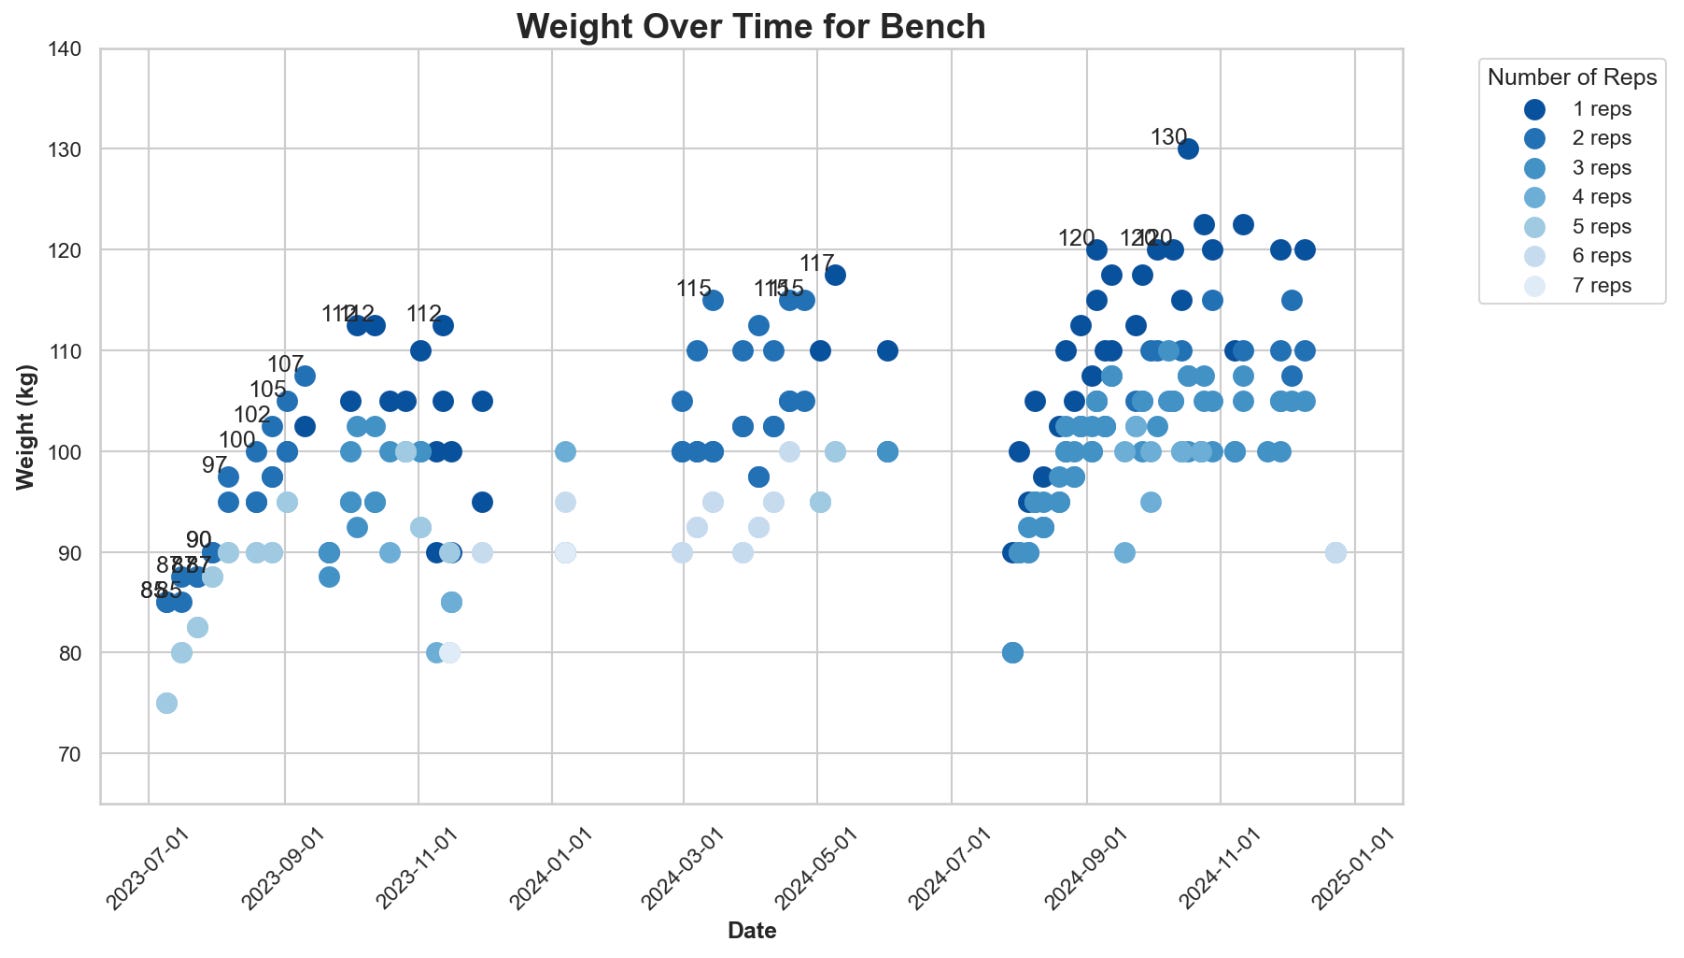
Maximum strength in power lifts also improved this year:
Deadlift: increased from 190 kg to 205 kg.
Bench press: increased from 117.5 kg to 130 kg.
Squat: increased from 145 kg to 150 kg.


Zone 2 Power
I define Zone 2 as the region just below the first rise in lactate on a progressive exercise test. This marks the point where energy production begins shifting from purely aerobic to partially anaerobic.
On my most recent test, my Zone 2 pace was measured at 4:30–5:00 min/km, improving from 5:00–5:30 min/km in January—a significant improvement. Notice how for the same zone 2 heart rate of 142 bpm, I can now run considerably faster.

Another way I track zone 2 power is by looking at changes in the lactate profile. Ideally, the lactate curve should shift to the right, indicating the ability to perform more work for the same level of lactate production. In this year’s test, the December curve shifted to the right of January’s curve, reflecting improved Zone 2 power.

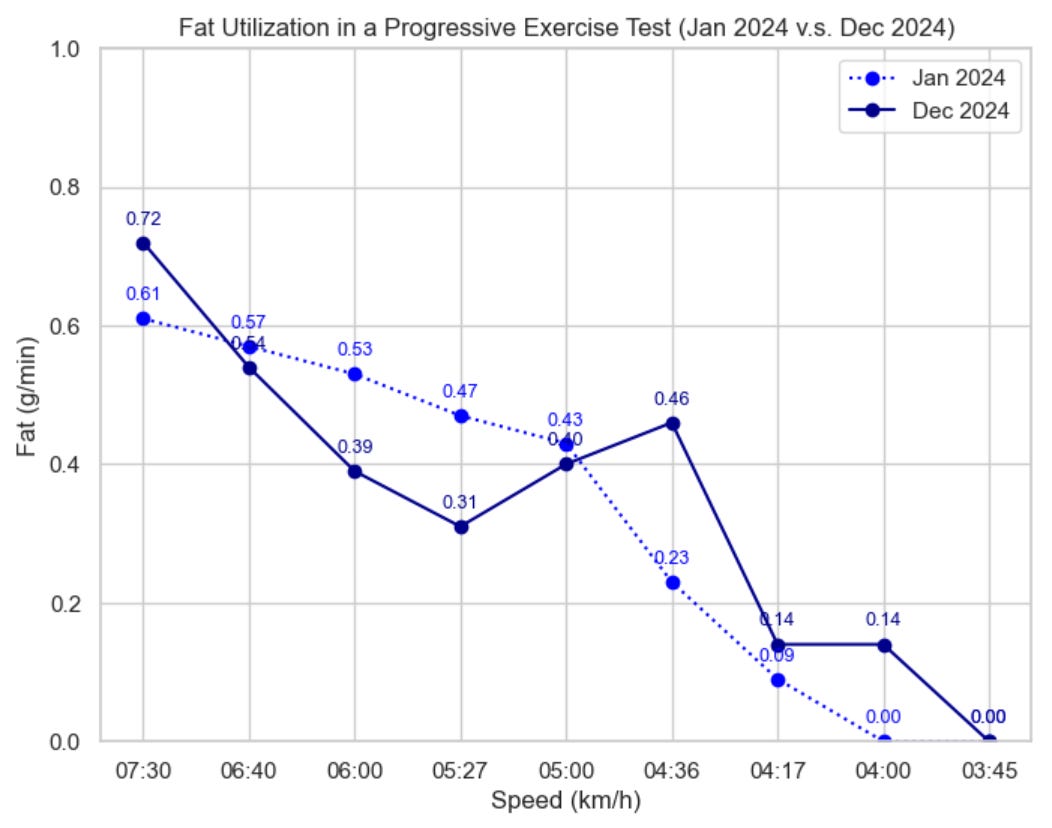
Fat utilization is another important measure of metabolic fitness. The most metabolically fit athletes are highly efficient fat burners, capable of oxidizing much more fat than most individuals. My fat-burning profile improved modestly over the year:
Fat Max: increased from 0.61 g/min to 0.72 g/min (elite athletes can exceed 1 g/min).
The fat-burning curve also broadened. In January, I burned no fat at a 4:00 min/km pace, whereas in December, I could utilize at least some fat at that intensity.
These are both good adaptations and reflect greater metabolic flexibility — I can now better utilize fat as a fuel source in addition to carbohydrates.
Training to Support Progress
Here’s the training that supported this progress:
Running: This was my dominant activity. I averaged 66 km/week (~55 minutes/day).
Most running was easy Zone 1/Zone 2 volume, which likely supported the rightward shift of the lactate curve.
I also attended a weekly track session, which likely helped to maintain top-end speed and might have contributed to the VO2 Max improvement.

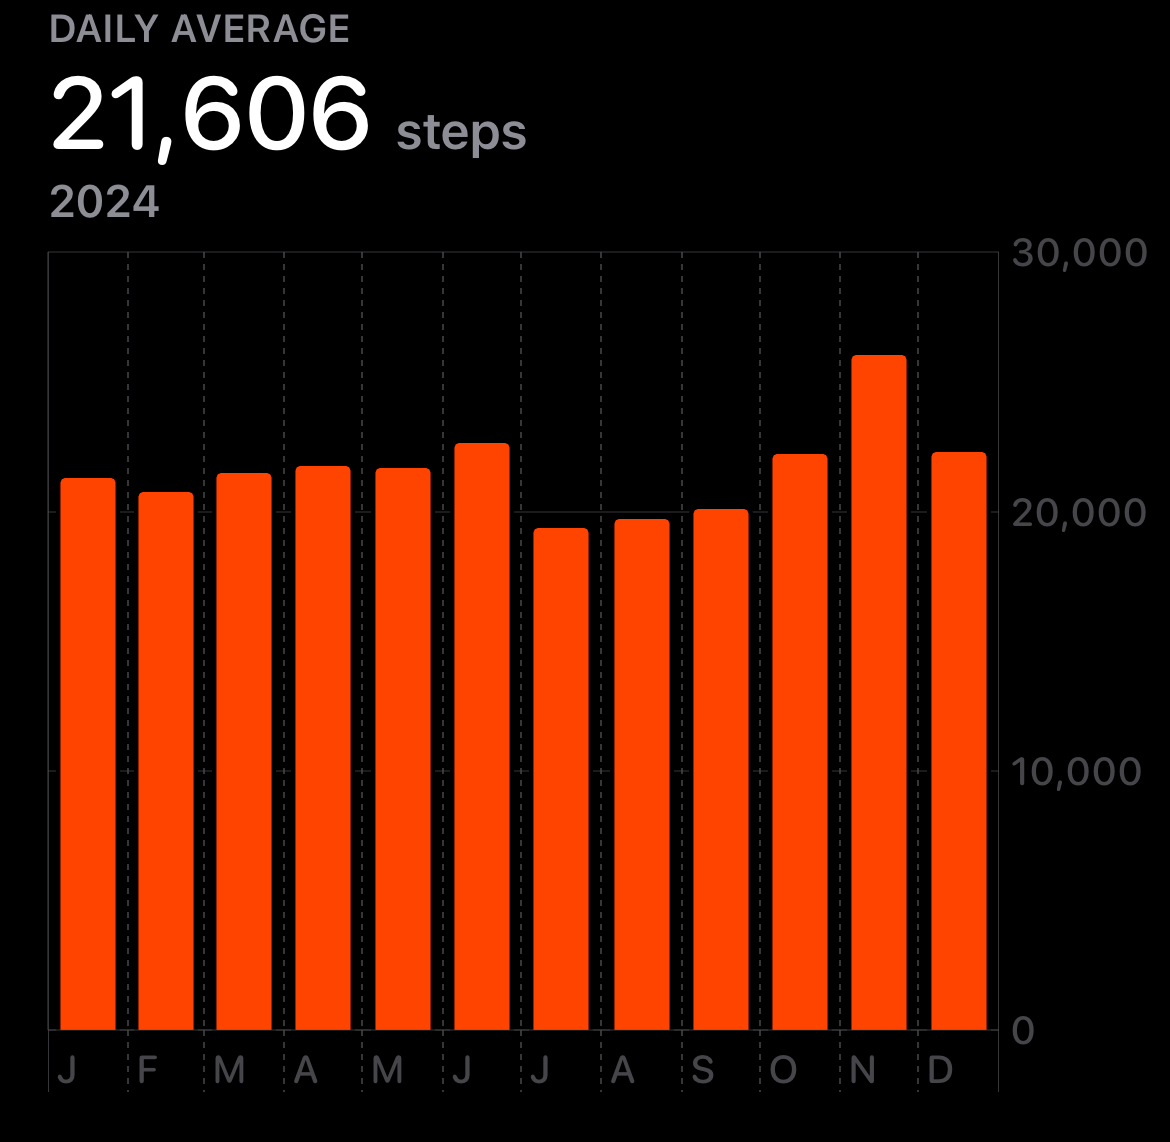
Walking: Approximately 1.5 hours/day. I estimate that half the steps below were from running, and half from the 1.5 hours/day of pure walking.
Strength Training: Averaged 28 sets/week over 131 total training days (~2.5 days/week), a relatively low-volume strength routine.

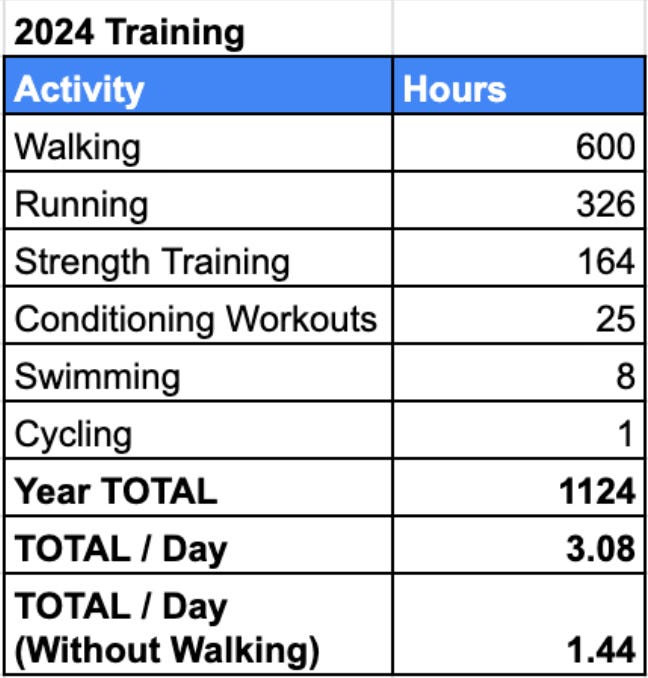
Training Time
Total training hours for the year: 524 (1.44 hours/day).
Including walking: 1,124 hours (3.08 activity hours/day).
Overall, I’m very satisfied with this year’s progress. I set out with a goal to hit certain metrics, and at this point I’ve essentially achieved that level of fitness. I feel like I have much greater capacity for training, I’m more injury resistant, and at this point I feel like I have a good grasp of the training needed to push forward both strength and endurance.
Going forward the plan will be to keep on making incremental progress, while seeking to maximize enjoyment along the way.
Thanks for following along!
Very thorough post! Why do you like FFMI over %BF?
how are you walking so much? multiple breaks throughout day? One long walk?